Understanding the current structure of effective Total Rewards functions
In the ever-evolving world of Human Resources (HR) and Total Rewards, staying updated with the latest trends and best practices is crucial for professionals at all levels. The recent Mercer Canada QuickPulse® Survey, conducted in February 2025, sheds light on the current state of HR and Total Rewards functions and their effectiveness among more than 200 organizations with an average global headcount of just over 4,100 employees (average headcount in Canada of 2,489).
This article highlights some of the findings from the survey that are particularly relevant for Total Rewards leaders looking to right-size their teams, improve their efficiency, and drive organizational success.
For the full report, covering a wide variety of structure, responsibilities, workflow, and effectiveness questions, give us a call at 855-286-5302 or click here
Structure and size of teams
Many companies are recognizing the importance of having dedicated teams focused on Total Rewards. One of the standout findings from the survey is the varying structure and size of Total Rewards teams across different organizations.
Seventy-seven percent of respondents reported having a Total Rewards team in their organization. Globally, the average team size is four employees, which, naturally, may vary by organization size; in aggregate, the ratio is 1.5 Total Rewards team members for every 500 employees.
The majority of survey respondents reported that their Total Rewards team has dedicated roles for Employee Compensation and Employee Benefits professionals. Forty-five percent of respondents reported having Total Rewards team members focused on Executive Compensation. Only thirty-five percent of respondents reported having a dedicated Work Life and Well-being function within their team.
Companies are planning to introduce or already have function leaders responsible for HR Analytics, Employee Experience, and Job/Talent Architecture.
Responsibilities of the function
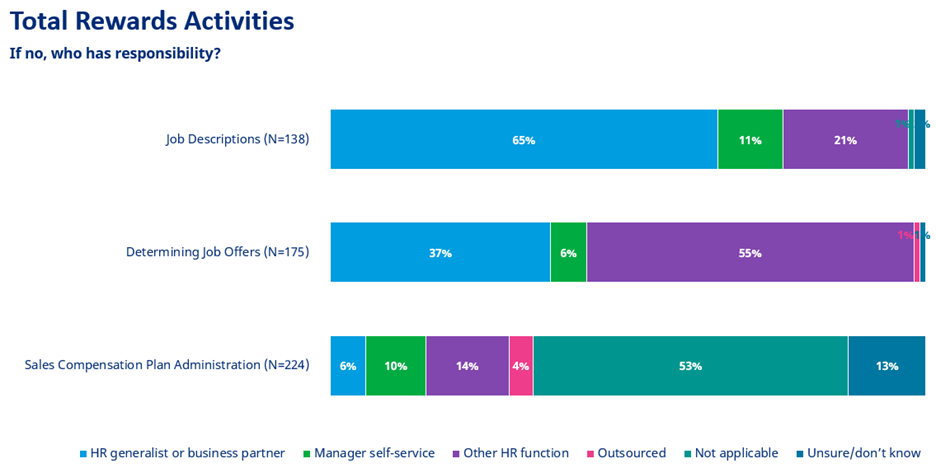
Predictably, more than three of every four survey respondents indicated that their Total Rewards team members are tasked with core compensation processes such as market compensation analysis, annual compensation process, job evaluation, and pay equity. However, other tasks, such as job description creation, sales compensation administration, and determining job offers, were not as frequently reported. If Total Rewards teams do not handle these responsibilities, then who does? Take a look at the chart below for a breakdown of the distributions of these three tasks across different functional teams.
Investments in the function
While 73% of respondents agreed that their organization’s Total Rewards function operates efficiently and effectively today, survey results show that many organizations have invested, or plan to invest, further in improving the effectiveness and efficiency of their Total Rewards team. More than fifty percent of respondents indicated that their company has made investments in third-party technology platforms or plans to in the next 12 months. Just under 50% of respondents reported that their company is planning to invest in data analytics and reporting capabilities within the next 12 months, on top of the 30% of companies that have already made investments in this function.
These findings underscore the importance of a company acquiring the necessary skills and tools to enhance data analytics and make informed decisions.
Technology and data use
Twenty percent of respondents reported that their companies use third-party technology for market data and compensation analysis, while a whopping 65% of companies still use only Excel to manage this process/function. Similarly, companies most often use Excel for incentive plan administration, job evaluation, and pay equity analytics . Just over 40% of companies are using their HCM/HRIS modules for compensation administration.
As for data sources, 92% of the survey participants reported that their organization uses traditional employer-sourced surveys to assess compensation. Just under two-thirds of respondents reported that their companies use more than one survey type, with two survey types being the most prevalent method for compensation benchmarking.
Interested in how AI can help with compensation management? Take a look at Mercer’s PayAI™.
Survey responses suggest that, as of now, artificial intelligence (AI) has not been leveraged by Canadian companies in the Total Rewards function—only 2% of respondents indicated that their company is currently using AI in their compensation program to help with planning, design, or management. It should be noted that 31% of respondents confirmed that they are exploring AI but have not determined whether they will use it, and 5% indicated that they plan to use it in the coming year.
Insight you can use
The Mercer Canada QuickPulse® Survey offers valuable insights for HR Leaders in these times of running a lean yet highly effective and innovative Total Rewards team. As the HR landscape continues to evolve, being adaptable and open to new ideas remains an essential skill. HR Leaders can embrace the findings from the survey as a roadmap for improvement and a guide to building an effective Total Rewards team and processes that will help deliver results.
Let the insights from the Mercer QuickPulse® Survey inspire you to take action and drive positive change in your HR practices.
Looking for a trusted advisor to guide you through the process? With Mercer’s extensive experience in transforming human resources functions across industries and around the world, let’s partner with you to identify opportunities, develop a plan for change, model outcomes, and measure results. How much more could you achieve with an optimized Total Rewards function?
Don’t forget! Participate in the next Mercer QuickPulse® Survey to receive the complimentary results.
Have additional questions? Call 855-286-5302 or email surveys@mercer.com.